If you’ve been searching for the latest Trump approval rating today, you’re in the right place. This article pulls together data from every major pollster ,Pew Research, Quinnipiac, AP-NORC, the New York Times polling average, and more ,to give you a clear, unbiased picture of where President Donald Trump stands in the eyes of the American public right now.
Let’s get into the numbers.
What Is Trump Approval Rating Today?
As of late February 2026, Donald Trump’s presidential approval rating sits in the 37–42% range depending on the pollster, with disapproval consistently above 54%. The New York Times polling average, which aggregates high-quality surveys and adjusts for statistical noise, currently shows Trump at 41% approval and 56% disapproval nationwide.
That puts the president more than 12 to 15 points underwater , meaning significantly more Americans disapprove of his job performance than approve of it.
Here’s a quick snapshot of where the major polls currently stand:
| Poll / Organization | Approval | Disapproval | Net |
| New York Times Average | 41% | 56% | -15 |
| Pew Research Center (Jan 2026) | 37% | 60%+ | -23+ |
| Big Data Poll (Feb 16–18) | 42.4% | 54.6% | -12 |
| AP-NORC (Feb 5–8) | ~37% | 63% | -26 |
| Quinnipiac (Jan 29–Feb 2) | ~40% | 59% | -19 |
| NBC/SurveyMonkey (Jan 27–Feb 6) | ~39% | 61% | -22 |
| Rasmussen/Morning Consult | ~46% | 51% | -5 |
| InsiderAdvantage (Feb 17–18) | 50% | 46% | +4 |
Note: Pollsters use different sampling methods (likely voters vs. registered voters vs. all adults), which explains the variation across surveys.
Why Are the Numbers So Different Across Polls?
This is one of the most common questions people ask about presidential approval ratings, and it’s a fair one.
The gap you see between, say, Rasmussen (which shows Trump near 46%) and AP-NORC (which shows him at a net -26) comes down to methodology. Rasmussen polls likely voters and uses automated phone calls, a method that tends to skew slightly Republican. AP-NORC surveys all American adults, including many who don’t vote regularly, which tends to produce lower approval numbers for Republican presidents.
Neither is “wrong.” They’re measuring slightly different things. The most reliable approach , and the one used by Silver Bulletin and the New York Times is to aggregate multiple polls, weight them by historical accuracy, and adjust for these house effects. That aggregate currently puts Trump at around net -12 to -15 approval.
How Does This Compare to Other Presidents at the Same Point?
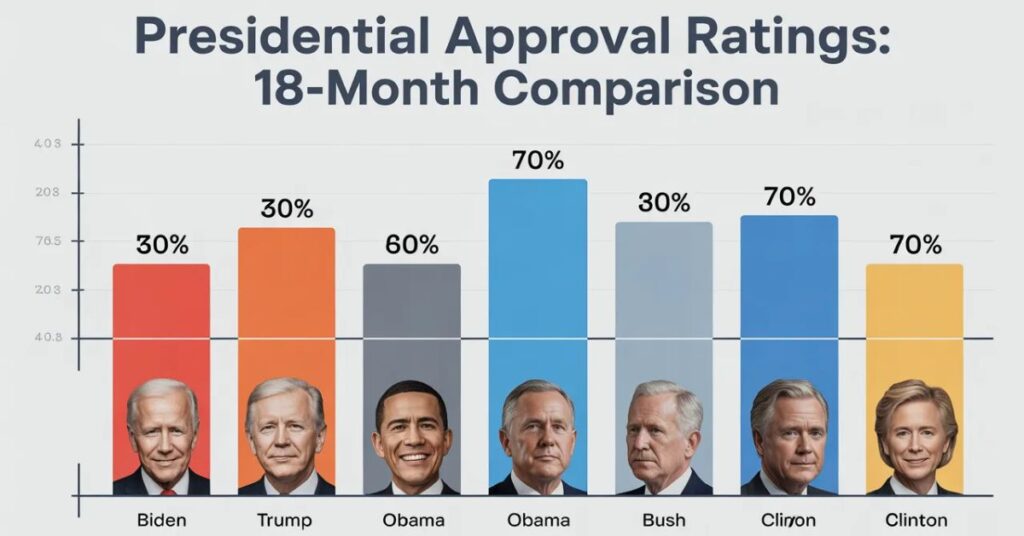
Context is everything in presidential polling. Here’s how Trump’s current second-term approval rating compares to other two-term presidents one year into their second terms:
- Barack Obama (Year 2 of 2nd term): net -8.5 approval
- George W. Bush (Year 2 of 2nd term): net -10.4 approval
- Donald Trump (Year 2 of 2nd term, 2026): net -12.9 approval
- Donald Trump (Year 2 of 1st term, 2018): net -16.4 approval
So Trump is tracking better than he did in his first term at this same point, but he is more unpopular than both Obama and Bush were during their second-term midpoint years. That’s a meaningful benchmark and it suggests headwinds for Republicans heading into the 2026 midterms.
Approval by Demographic: Who Still Supports Trump?
Breaking down presidential job approval by demographic group is one of the most revealing parts of any polling analysis. According to Pew Research Center’s January 2026 survey of 8,512 U.S. adults:
Groups with higher Trump approval:
- Republicans: 73% approve (down slightly from September 2025)
- Older Americans (65+): approve at above-average rates
- White adults without a college degree: consistently among Trump’s strongest supporters
- Rural voters: remain a core base of support
Groups with lower Trump approval:
- Democrats: overwhelmingly disapprove; 82% want their congressional leaders to actively push back against Trump
- College-educated adults: disapproval has grown over the past year
- Non-white Americans: approve at significantly below-average rates
- Younger voters (18–34): among the most disapproving age cohort
One of the more notable findings in the Pew data is that the decline in support since Trump took office has come entirely from within the Republican Party. Only 27% of Americans now say they support all or most of Trump’s policies down from 35% at the start of his second term. That drop is driven by softening Republican enthusiasm, not a shift among Democrats or independents (who were already opposed).
Swing State Approval: The Numbers That Really Matter
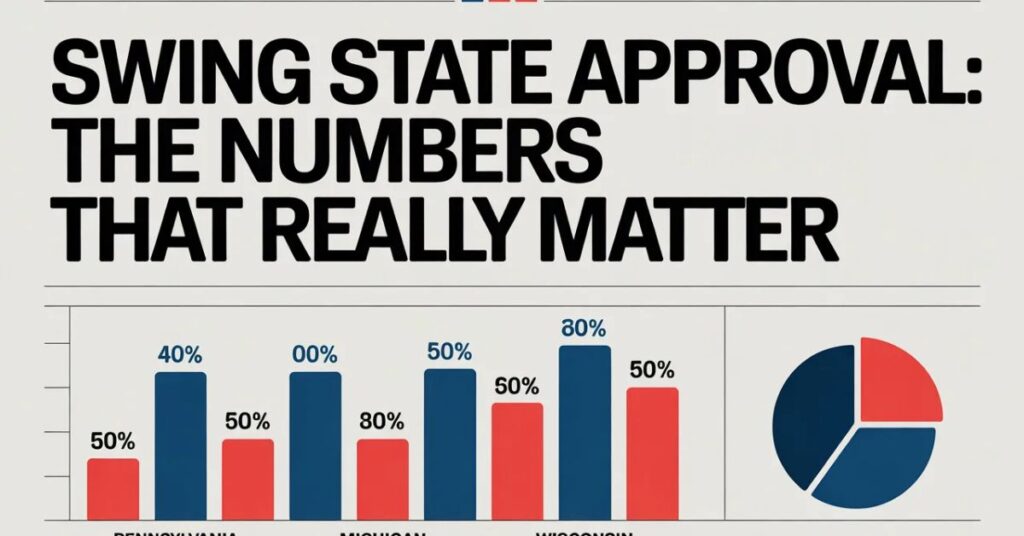
National approval ratings matter for the political climate, but swing state numbers matter for elections. Here’s what recent state-level polling shows:
Wisconsin: A TechnoMetrica (TIPP) poll conducted for the League of American Workers found Trump at 39% approval and 54% disapproval among registered voters, a net of -15. Wisconsin is one of the most closely watched battleground states heading into 2026 Senate races and the 2028 presidential cycle.
While state-by-state polling is less frequent than national surveys, analysts note that Trump is running “deeply underwater” in most competitive swing states, including Pennsylvania, Michigan, and Arizona. This is a potentially significant problem for Republican candidates in those states who must decide how closely to align themselves with the White House.
What Issues Are Driving Disapproval?
Approval ratings don’t exist in a vacuum they’re driven by how people feel about specific policies and leadership qualities. The polling paints a clear picture of what’s dragging Trump’s numbers down:
Economic concerns are the dominant driver. While Trump’s economic approval has recovered slightly from its low point earlier in the year (net -20 in early 2026 to around net -16.5 as of mid-February), Americans remain deeply skeptical of his handling of inflation, cost of living, and job market conditions. Across every major poll, economic disapproval outweighs approval.
Immigration was once Trump’s strongest issue, but that’s changed. His approval on immigration handling hit a second-term low of net -10 in Silver Bulletin’s aggregate in January 2026 — a notable shift given that immigration enforcement was central to his re-election campaign and early second-term agenda.
Ethical concerns run deep. Pew Research found that just 21% of Americans are extremely or very confident that Trump acts ethically in office — down 8 points from the previous February. That’s the lowest confidence score across all the leadership qualities Pew tested, including mental fitness, leadership skills, and respect for democratic values.
Leadership and fitness: About 34% of Americans say they are extremely or very confident in Trump’s leadership skills, while 51% are not at all or not very confident. Similar numbers apply to mental fitness (52% not confident) and physical fitness (50% not confident).
The Intensity Factor: Strong Disapproval Is Growing
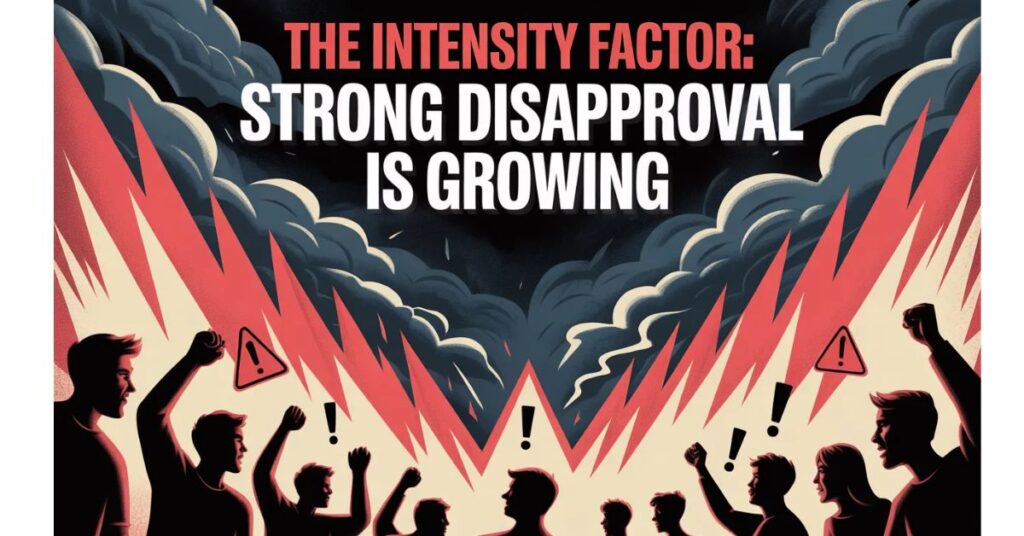
One number that doesn’t get enough attention in approval rating coverage is the intensity index the gap between strong approval and strong disapproval. This matters because strongly motivated voters are the ones who show up in midterms.
According to polling data cited by Newsweek, 43% of registered voters strongly disapprove of Trump’s job performance, a share that now exceeds the total percentage who approve of him at all. The intensity of disapproval has been widening since late 2025, suggesting that opposition to Trump is consolidating and hardening rather than easing.
This is the kind of metric that keeps Republican strategists up at night ahead of the November 2026 midterms.
What Do Americans Think About Trump’s Long-Term Legacy?
Beyond day-to-day job approval, pollsters also ask about long-term presidential success and those numbers are striking. According to Pew Research, nearly half of Americans (47%) now say Trump will be an unsuccessful president in the long term. That figure is up 14 percentage points since last year, with most of the change occurring among Democrats.
A majority of Republicans still believe Trump will be seen as a successful president historically but the broader public view has shifted considerably.
Impact on the 2026 Midterm Elections
Presidential approval ratings are one of the strongest predictors of midterm election outcomes. When a sitting president is unpopular, voters tend to punish his party’s congressional candidates, regardless of those candidates’ individual records.
Historically, any president polling below 50% approval sees his party lose House and Senate seats in the midterms. With Trump consistently polling in the high 30s to low 40s depending on the pollster and with strong disapproval concentrated in key swing districts Republican candidates in competitive races face a real dilemma: distance themselves from the White House and risk alienating the Trump base, or stay close and risk being dragged down by national disapproval numbers.
As of February 2026, the generic congressional ballot which measures whether voters prefer a Republican or Democratic candidate for Congress also leans toward Democrats, though that gap has narrowed slightly in recent weeks. Midterm elections are still roughly nine months away, and a great deal can change. But the structural environment currently favors Democrats picking up seats in the House, and competitive Senate races in states like Wisconsin, Pennsylvania, and Ohio are expected to be closely fought.
How Are These Polls Conducted? (Methodology Explained)
Understanding how presidential approval polls work helps you interpret the numbers more intelligently.
Most major polls survey between 800 and 8,500 Americans, either by phone (live callers or automated), online panel, or a combination of methods including SMS text outreach. Results are weighted by demographics age, sex, race, education, and geography to ensure the sample reflects the actual U.S. population.
The margin of error on most national polls ranges from ±2 to ±3.5 percentage points at the 95% confidence level. That means if a poll shows 42% approval, the true number is likely somewhere between about 39% and 45%.
Aggregators like the New York Times, Silver Bulletin (Nate Silver’s publication), and RealClearPolling combine multiple surveys to reduce the noise from any single poll. They weight surveys based on historical pollster accuracy, adjust for house effects (systematic biases toward one party), and account for methodological differences. These aggregated averages are generally more reliable than any single poll in isolation.
Expert Political Analysis: What Does This Really Mean?

Political analysts offer a few key takeaways from the current polling landscape:
The breadth of Trump’s second-term lows is notable. Across AP-NORC, NBC, Quinnipiac, and Yahoo-YouGov, Trump has simultaneously hit second-term lows in all four surveys. As one CNN analyst put it, the question isn’t where the floor is, it’s whether there is one.
At the same time, not every analyst sees catastrophe for Republicans. Some point to the structural advantages Republicans built into state-level redistricting after 2020, which make flipping the House harder than the national numbers might suggest. And one outlier poll InsiderAdvantage’s February 17–18 survey of likely voters actually shows Trump narrowly above water at 50% approval, a reminder that polling is imprecise and individual surveys can diverge substantially from the consensus.
The most reasonable interpretation of the current data, as Silver Bulletin’s analysts note, is that Trump is unpopular but not historically so he’s tracking similarly to other second-term presidents who faced headwinds during their middle years, and elections nine months away remain genuinely uncertain.
Month-by-Month Trend: How Has Trump’s Approval Changed?
Here’s a simplified timeline of how Trump’s second-term approval has trended based on aggregated polling data:
- January 2025 (Inauguration): Approval near 47–48%, buoyed by post-election goodwill
- Spring 2025: Gradual softening as early policy moves generated controversy
- Fall 2025 (September): Pew records approval at 40%; Republican support at 75%
- January 2026 (1-year mark): Pew records approval at 37%; Republican support drops to 73%
- February 2026 (current): Aggregated polls show 41% approval, 56% disapproval (NYT average); net approval at historic second-term lows across multiple pollsters
The trend line is clear: approval has declined steadily over the past year, with the most notable acceleration occurring in late 2025 and early 2026.
Frequently Asked Questions
What is Trump’s approval rating right now?
As of February 2026, Trump’s approval rating in most polls ranges from 37% to 42%, with disapproval above 54%. The New York Times aggregated average shows 41% approval and 56% disapproval.
Which poll is most accurate for Trump’s approval rating?
No single poll is definitively “most accurate.” Aggregators like the New York Times polling average and Silver Bulletin, which combine multiple surveys weighted by historical accuracy, are generally more reliable than any individual poll.
How does Trump’s current approval compare to his first term?
Trump is currently more popular than he was at this same point in his first term. His net approval in early 2026 sits around -12 to -15, compared to -16.4 at the equivalent point in 2018.
Is Trump more popular or less popular than Obama at this stage?
Less popular. Obama had a net approval of -8.5 at the same point in his second term. George W. Bush had a net of -10.4. Trump’s is currently around -12.9.
How will Trump’s approval rating affect the 2026 midterms?
Presidential approval is one of the strongest predictors of midterm performance. With Trump consistently below 50%, historical patterns suggest Republicans could face meaningful losses in competitive House and Senate races, though redistricting and turnout dynamics also play major roles.
Marvi Channa is the author at DailyNewsHub.site, sharing breaking news, tech updates, sports highlights, and trending global stories with clarity and credibility. She’s passionate about timely reporting and keeping readers informed fast

Pingback: Startup News Today 2026 Explained: Latest Funding, New Startups & Tech Trends
Pingback: New Tech Startup Funding News: Latest Investment Rounds and Venture Capital Trends in 2026